

Making business decisions based on real, objective data is crucial for any company's success. This is where the importance of relying on Key Performance Indicators (KPIs), especially Logistics KPIs, emerges. These are quantitative metrics that illustrate the quality of performance in completing tasks throughout a brand's supply chain journey, from resource procurement to final delivery to consumers.
By monitoring your logistics KPIs, you can identify areas needing improvement, pinpoint opportunities for cost reduction, enhance customer satisfaction, and boost your company's competitive value.
This guide covers the key logistics KPIs and shipping KPIs every e-commerce and logistics business should track in 2026, including formulas, benchmark targets, and improvement steps for each.
Key Logistics Performance Indicators to Monitor for Efficient Operations
Logistics KPIs are quantitative metrics that measure the performance of operations across your supply chain, from procurement to final delivery. They are typically grouped into three operational categories: shipping KPIs, warehouse and inventory KPIs, and returns KPIs.
Together they give you a complete, data-driven picture of where your logistics operation is performing well and where it is not.'
First: Shipping KPIs
These metrics are used to measure and evaluate the performance of shipping and delivery operations in the logistics supply chain. They aim to determine the efficiency and effectiveness of shipping-related processes and provide a comprehensive view of the company's performance and potential improvements.
1. Number of Shipments
This KPI reflects the number of shipments processed and delivered within a specific period.
Importance:
Resource Planning: Helps determine the volume of resources required to meet demand and execute operations efficiently.
Performance Evaluation: Comparing shipment numbers over time indicates growth patterns and operational efficiency.
Logistics Network Planning: Supports improving the logistics network, including warehouse locations and distribution points.
Cost Analysis: Aids in calculating transport, storage, and distribution costs and estimating profitability.
2. Shipping Time
This is the time taken to transport goods or products from the storage location to the customer's location. It significantly impacts customer experience and logistics costs.
Influencing Factors: Distance, transport method, agreed-upon service level (e.g., express shipping), and external disruptions (weather, customs).
Benefits for Businesses:
Operational Efficiency: Effectively managing shipping time enhances supply chain efficiency.
Carrier Performance: Measures shipping companies' adherence to pre-defined Service Level Agreements (SLAs).
Competitive Value: Boosts market competitiveness and customer satisfaction.
3. Delivery Time
A vital KPI that evaluates the performance of shipping and delivery operations. It is the time taken to deliver products from the shipment point to the intended destination.
Importance: Adhering to agreed-upon delivery times increases customer satisfaction and loyalty, as it reflects the business's organization and efficiency.
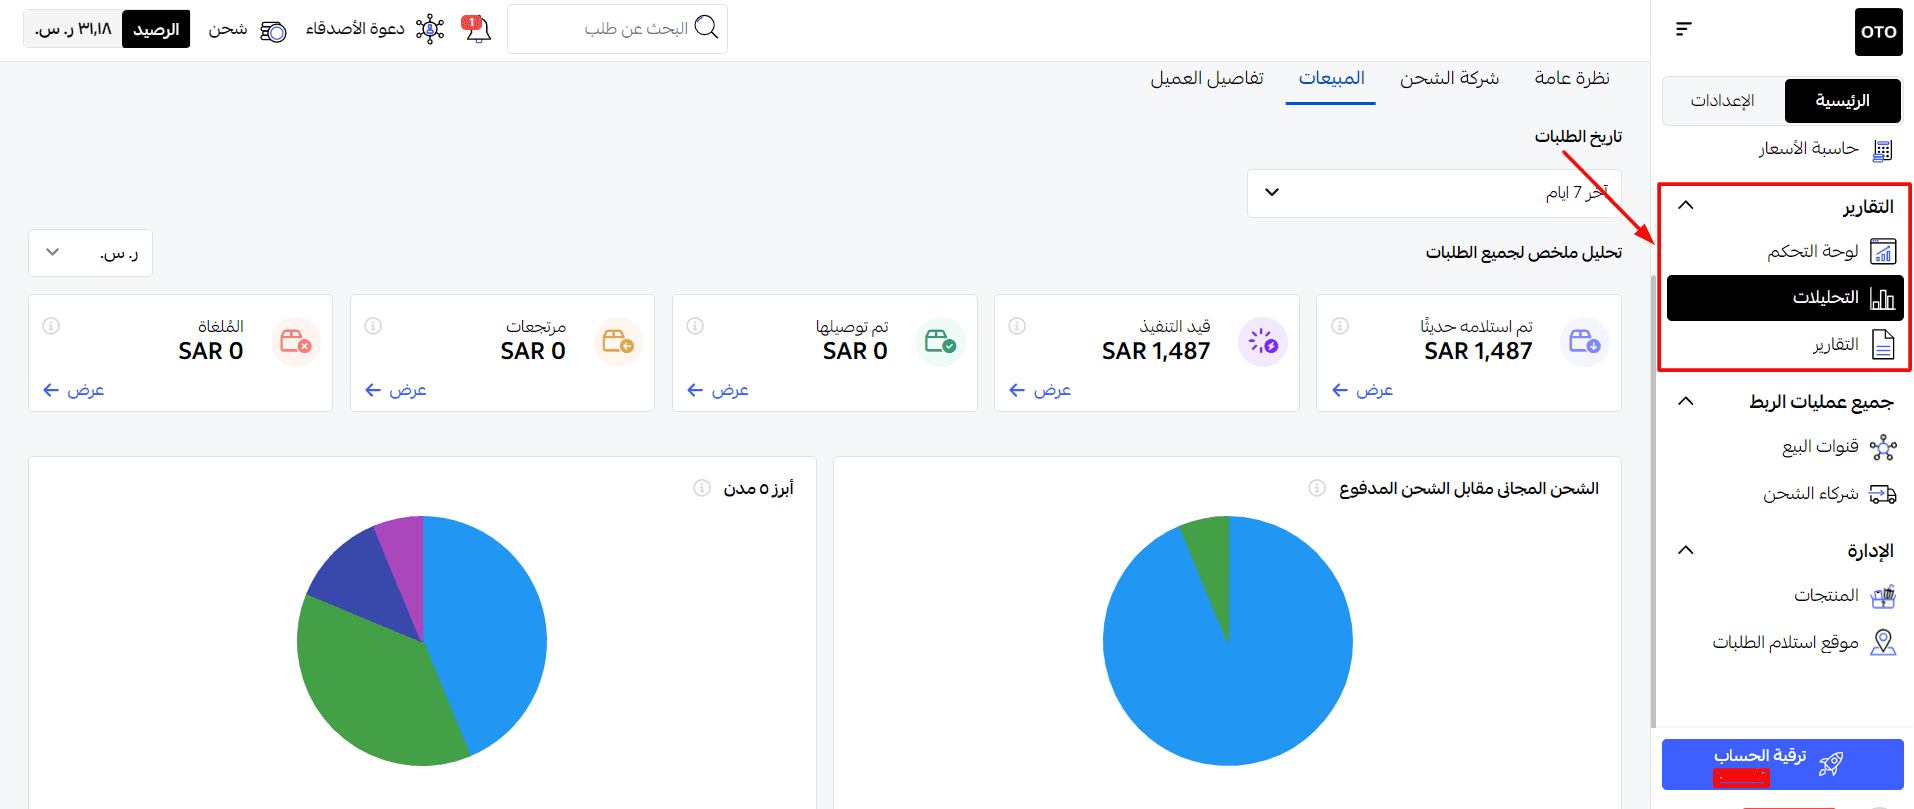
Note: OTO, a leading shipping gateway, allows its customers to ship with over 200 local and global carriers. Crucially, its integrated control panel enables effortless monitoring and measurement of all these KPIs, allowing you to generate detailed reports on your logistics performance.
4. Cost Per KM
This KPI indicates the cost incurred when transporting goods over a specific distance. Determining the Cost Per KM is crucial for achieving higher profitability and efficiency in the supply chain.
Role:
Measuring Transport Cost: Calculated by dividing the transport cost by the distance traveled in kilometers.
Efficiency Improvement: Helps identify areas for cost reduction through optimizing routes and using more efficient transport methods.
Identifying Additional Costs: Helps account for costs like insurance or express transport.
Market Changes: Reflects market variations (fuel prices, maintenance costs).
5. Punctuality Rate
Measures the performance of goods delivery services against the agreed-upon schedule and time with customers.
Significance: A high rate indicates the ability to meet time commitments, fostering customer satisfaction and building a good reputation. A low rate leads to customer dissatisfaction and loss of trust.
Calculation:
$$\text{Punctuality Rate} = \left( \frac{\text{Number of On-Time Shipments}}{\text{Total Number of Shipments}} \right) \times 100$$
Example: If 900 out of 1,000 shipments were delivered on time, the rate is $90\%$.
Influencing Factors: Supply chain delays, road/traffic conditions, capacity exceeding available resources, inventory issues, poor planning, and team skill gaps.
6. Loss and Damage Rate
Indicates the percentage of products or goods that are lost or damaged during transport and handling.
Causes: Poor packaging, unprofessional handling, unprofessional inventory management, and changing environmental conditions (temperature, humidity).
Monitoring Importance: Regular monitoring helps identify the root causes of loss/damage, allowing for corrective actions to avoid additional costs and loss of consumer trust.
Improvement Steps:
Enhance packaging efficiency.
Use advanced tracking and monitoring technologies.
Improve inventory management systems.
Provide adequate training and awareness to staff on proper handling.
7. Fleet Utilization Rate
Reflects the efficiency of using a company's vehicles and equipment to meet customer needs and execute logistics operations effectively.
Role:
Operational Efficiency: High, consistent vehicle use indicates efficient operation and a good return on fleet investment.
Asset Utilization: Consistent operation means the company is leveraging its assets for good returns.
Cost-Revenue Balance: Efficient fleet use reduces costs (fuel, maintenance), improving the overall profit margin.
Logistics Planning: Monitoring fleet performance helps identify peak demand periods for better scheduling and capacity planning.
Improvement Steps: Optimize planning/coordination (using scheduling software), perform regular maintenance (using a Fleet Maintenance Management System), monitor vehicle movement (using GPS), and train drivers on safe and fuel-efficient driving.
OTO FLEX is a system offered by OTO to manage the shipping fleet of drivers effectively and monitor their performance.

Second: Warehouse Management and Inventory KPIs
These metrics measure the effectiveness and efficiency of storage and distribution operations within warehouses.
1. Unit Storage Cost
The total cost associated with storing, preserving, and managing each product unit in the warehouse over a period. It includes costs like rent, maintenance, utilities, and equipment.
Benefits of Tracking:
Financial Efficiency: Determines the actual cost of storing each unit for financial evaluation and cost reduction.
Benchmarking: Compares performance across different warehouses or competitors.
Efficiency Opportunities: Identifies opportunities to optimize storage (e.g., better organization, using automation).
2. Transport Cost Per Sale
The total cost of transporting products from warehouses to customers or distribution points during a sale.
Importance:
Weakness Identification: Helps pinpoint areas for improvement to balance transport cost and service quality for higher profitability.
Strategic Decision Making: Provides valuable information for defining policies to improve long-term efficiency and reduce costs.
Supplier Evaluation: Assesses the performance of carriers and transport partners for ongoing collaboration.
3. Order Handling Time
The time taken to process orders from the moment the order is placed until it is delivered to the customer. This includes all activities within the warehouse (picking, packing, checking, and handover to the carrier).
Importance: Essential for ensuring fast and efficient processing, preventing loss of brand trust due to delays, avoiding additional costs from long processing times, and protecting the company's reputation.
Improvement Steps: Optimize internal preparation processes, organize inventory, use continuous improvement techniques, provide staff training, and utilize Warehouse Management Systems like OTO PACK for better picking and packing.
4. Rotation Index (Inventory Turnover)
A key logistics KPI that reflects the efficiency of inventory use and replenishment. It measures the quantity of inventory sold or consumed compared to the total available inventory.
Calculation:
$$\text{Inventory Turnover} = \frac{\text{Cost of Goods Sold}}{\text{Average Inventory}}$$
Example: A company with $100,000$ in COGS and an average inventory of $45,000$ has a turnover of $2.22$ times per year.
Benefits: Estimates inventory management efficiency, reduces holding costs, and maximizes returns on investment.
5. Inventory Accuracy
Measures the extent to which the physical inventory data in warehouses matches the recorded data, indicating the company's ability to maintain accurate inventory records.
Calculation:
$$\text{Inventory Accuracy} = \left( \frac{\text{Number of Matching Items}}{\text{Total Number of Items in Inventory}} \right) \times 100$$
Importance: Timely fulfillment, reduced costs from overstocking or shortages, better production planning, reduced inventory losses (spoilage), and enhanced supply chain efficiency.
6. Out of Stock
Indicates when a specific product is unavailable or insufficient to meet current demand.
Consequences: Loss of sales, customers switching to competitors, additional costs for urgent orders, and problems with demand forecasting.
Monitoring Steps: Conduct regular inventory counts, use an Inventory Management System (IMS) like OTO PACK for real-time tracking and automated alerts, and enhance collaboration with suppliers.
Third: Returns KPIs
These KPIs measure a company's efficiency in handling customer returns. They aim to understand the volume and analyze the causes of returns to improve processes.
Return Rate: Measures the percentage of products returned compared to total products sold, reflecting customer satisfaction.
Reasons for Returns: Records the causes of returns (quality issues, shipping errors, dissatisfaction), helping identify and address main problems.
Return Processing Time: The interval between receiving a returned product and completing the processing, estimating the efficiency of internal operations.
Resale Rate of Returned Products: Measures the percentage of returned products that are resold, determining the resale value as part of returns management.
Quality Metrics for Returned Products: Monitors the quality of returned products to determine if they need refurbishing, repackaging, or disposal.
🌟 Importance of Logistics KPIs for Businesses
Monitoring logistics KPIs allows businesses to create an integrated plan based on available data, track progress, and intervene immediately when necessary.
Improved Operational Efficiency: Provides details on process efficiency, helping identify areas for improvement and cost reduction.
Meeting Customer Needs: Helps assess the company's ability to meet customer needs and measure satisfaction.
Better Inventory Management: Aids in evaluating inventory management performance and warehouse efficiency, reducing storage costs, and improving product availability.
In general, logistics KPIs provide a standard framework for evaluating performance, comparing it against benchmarks, and making sound strategic decisions.
How to Set Up Logistics KPI Tracking for Your Business
Knowing which logistics KPIs to track is only the first step. Setting up a system to track them consistently is where most businesses struggle. Here is a practical approach:
Step 1: Define your baseline
Before you can improve, you need to know where you are starting. For each KPI you decide to track, calculate your current performance using the past 30 to 90 days of data. This baseline becomes the reference point against which all future measurements are compared.
Step 2: Prioritise the KPIs that matter most for your operation
Not every KPI is equally important for every business. A fast-fashion store should prioritise return rate and return processing time. A heavy goods seller should prioritise cost per shipment and fleet utilization. A high-SKU operation should prioritise inventory accuracy and out-of-stock rate. Focus your initial KPI programme on the five to seven metrics that have the most direct impact on your specific operational goals.
Step 3: Choose your tracking tools
Manual tracking using spreadsheets is feasible for very low-volume operations but becomes unsustainable quickly. For most e-commerce businesses, KPI tracking should be integrated into your operational systems: your WMS for warehouse KPIs, your shipping platform for shipping KPIs, and your returns management system for returns KPIs. Platforms like Oto aggregate shipping performance data across all carriers automatically, eliminating the need to manually compile reports from multiple carrier portals.
Step 4: Set targets and review cadence
Every KPI should have a target and a review cadence. Use the benchmarks in this guide as your starting targets and adjust based on your specific product categories and operational context. Review shipping KPIs weekly.
Review warehouse and inventory KPIs monthly. Review returns KPIs monthly with a quarterly deep-dive into return reason analysis.
Step 5: Build a response protocol for each KPI
A KPI that triggers no action is just a number. For each KPI, define in advance what action is triggered when it falls below the target. For example, if the on-time delivery rate falls below 90%, the protocol is to identify the affected routes, review carrier performance for those routes, and switch routes to an alternative carrier if the performance does not recover within two weeks.
Defined response protocols turn KPI monitoring from a reporting exercise into an operational improvement system.
✅ General Guidelines for Maximizing Logistics KPIs
Focus: Concentrate on KPIs that significantly contribute to monitoring your strategic goals.
Avoid Overload: Limit the number of indicators to maintain focus on key logistical aspects.
Review Periodically: Use periodic evaluation to analyze trends and take timely action.
Technology: Utilize advanced IT systems to facilitate data collection and analysis.
Continuous Improvement: Use KPIs to pinpoint areas for continuous improvement.
Training: Provide ongoing training to logistics teams on how to read, understand, and use KPIs.
It is important to emphasize that logistics needs differ significantly between companies based on their goals and industry (e.g., a company selling perishables focuses on delivery speed, while one selling heavy goods focuses on transport costs). Therefore, choosing the appropriate KPIs for your company's needs is crucial for measuring performance and ensuring sustainability and growth.
Tracking logistics KPIs consistently is what separates businesses that react to problems after they occur from those that identify and fix them before they affect customers. The most effective way to monitor all your logistics KPIs in one place — shipping performance, warehouse efficiency, and returns metrics — is through a logistics platform that aggregates your data automatically. Oto's platform provides a unified dashboard for tracking shipping KPIs across all carriers, managing warehouse operations through OTO PACK, and monitoring fleet performance through OTO FLEX. Create your free account at tryoto.com.
FAQs About Logistics KPIs
Q1: What are logistics KPIs and why are they important?
Logistics KPIs (Key Performance Indicators) are quantitative metrics that measure how well your logistics operations are performing across shipping, warehouse management, and returns handling.
They are important because they turn operational activity into measurable data, allowing you to identify where costs are higher than they should be, where processes are slower than they need to be, and where customer experience is being negatively affected. Without tracking logistics KPIs, businesses make decisions based on assumption rather than evidence, which consistently produces worse outcomes.
Q2: What are the most important shipping KPIs to track?
The five most important shipping KPIs for e-commerce businesses are: on-time delivery rate (target above 95%), loss and damage rate (target below 1%), cost per shipment (track as a percentage of average order value), punctuality rate against carrier SLAs, and number of shipments by period (for growth tracking and carrier capacity planning).
Of these, on-time delivery rate is the single metric most directly connected to customer satisfaction and repeat purchase behaviour.
Q3: What is a good inventory turnover rate for e-commerce?
A good inventory turnover rate varies significantly by product category. For fashion and apparel, 4 to 6 times per year is typical. For consumer electronics, 6 to 12 times per year. For fast-moving consumer goods and food, turnover should be much higher.
A turnover rate significantly below your category average indicates overstocking or slow-moving SKUs that are tying up capital and increasing holding costs. A rate significantly above average may indicate understocking and risk of stockouts.
Q4: How do I calculate my return rate?
Return rate is calculated as: (Number of Returns / Total Orders Shipped) x 100. For example, if you shipped 1,000 orders in a month and received 45 returns, your return rate is 4.5%. Track return rate monthly and also break it down by product category, since return rates can vary dramatically between categories.
Fashion typically runs 10 to 20% return rates. Electronics run 5 to 10%. If your return rate is above 10% for non-fashion categories, conduct a root cause analysis across product descriptions, packaging quality, and picking accuracy.
Q5: How many logistics KPIs should I track?
The guidelines section of this article recommends limiting your KPI set to maintain focus. For most e-commerce businesses, tracking 7 to 10 logistics KPIs consistently is more effective than attempting to track 20 or more.
Start with the five most impactful KPIs for your specific operation, establish baselines, and only add additional KPIs once the initial set is embedded in your regular review process. Tracking too many KPIs simultaneously dilutes attention and makes it harder to act decisively when a metric falls below its target.

إيهاب محمود


